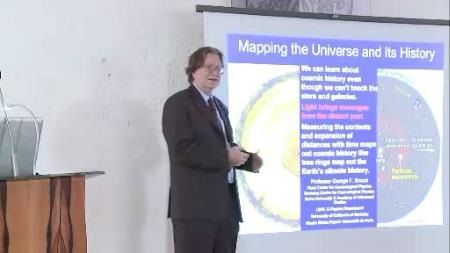
I’m going to talk about how we can learn about cosmic history,
even though we can’t go out and touch the stars on the galaxies and interact with them,
and this was an issue that people thought about, so there was even a famous essay by Comte in 1831
saying we’ll never know the composition of stars and galaxies, because we can’t go out and explore them.
And it was only 20 years later that a German scientist discovered that you could see lines of elements in the stars
and you could compare to the lines of the elements you saw on the earth to the lines you saw in the stars
and that it was like reading the bar code, you can tell what the products were because somebody had them manufactured that way.
And so up till this point, almost all the information we have about the distant universe comes from the light,
that is electromagnetic waves that come to us, so I use light generically, it´s not just visible light,
it´s x-ray, it´s through radio waves, microwaves.
And there is just a very little bit less, you know, information from other sources.
We know a little bit from neutrinos, we know a little bit from cosmic rays,
if you’re here on Thursday you will hear a talk on the Auger, where you´re looking at cosmic rays.
Basically the cosmic rays are high energy particles that sometimes make it to us from relatively nearby,
compared to what we’re going to be talking about,
but they tell us that a lot of the universe is made of the same elements the solar system is made of,
and a number of other things like that.
But what we’re going to talk about now is how we’re going to measure,
how we’re going to map everything that’s available to us in the universe, that’s our goal now,
to map the entire exploral volume of the universe, just like, you know,
there was a time when the great explorers went to see the earth and discovered the continents,
and then to map it more precisely and so forth.
We are in the business of starting to map the universe, and when we’re mapping the universe,
we’re mapping the history of the universe as well as mapping the contents of the universe.
And so we can do something simple, it´s very simple, here’s the analogy, here’s a cross section of a tree,
and you know that if you look carefully at a cross section of a tree like this, that the tree started growing,
and each year it puts a ring around it, right, you have these nice markers
and by measuring how much growth there is each year, you can tell how many nutrients there were,
or what was going on in the environment of the tree.
And we have a similar kind of thing that we try and do for the universe,
one of the simple things we try to do is simply measure the trajectory.
How much is the universe growing?
You should know the universe is expanding, so we try to say how much does it expand each year,
just like how much did the tree expand each year tells us something about the nutrients,
how much the universe expands each year tells us something about the dynamics that’s driving the trajectory of the universe.
There’s a kinematics that we observe, and it´s come from the dynamics of the forces that are involved in it.
And we know there’s something that happens here at the beginning, the Big Bang,
that’s the simple sort of beginning of the tree, and that the universe, once we start observing it,
it´s expanding, but the rate of expansion is slowing down, structure is forming.
And then a little before the solar system started to form, we see the expansion starts to speed up.
So if we measure the tree rings of the universe we see they’re getting closer and closer together,
and then it turns around and they start getting further and further apart.
And that was a big surprise, that was sort of discovered first in a way that made people sit up and take notice in 1998.
And it really wasn’t for a few more years, till early 2000, that is within your lifetime,
that people started to be convinced that the universe is starting to accelerate its rate of expansion again.
And that had dire consequences, even worse than Laughlin was telling you about the future of energy,
that if you really think you´re very clever and very smart, and you have an accelerating universe,
the total amount of things you have access to to make into fuels and to live forever is finite,
and it’s a difficult problem to solve, but I’m sure that you know some future generation will happily be worrying about this.
Ok, so I’m going to talk about this and I’ll go through a couple of things
just to remind you that we have a little bit of history.
John Mather did a little history this morning but this year is a famous year,
because 401 years ago Galileo made the first telescope that was used to point to the heavens,
that is he augmented the human eye with an instrument that actually magnified its collecting power,
and not just a way to get angles better but to actually magnify what was going on, and 400 years ago he published.
So that’s one of the things that as a young researcher, not only had to invent something and discover something,
you have to publish it and if you´re in Galileo’s case, he thought it was so important, he published it at a time,
and he got in trouble with the church, but in the end the church apologised, you know, so it´s ok.
But it´s very impressive, because with that little tiny telescope he made 4 incredible discoveries,
he discovered the moons of Jupiter, there are 4 moons of Jupiter he was able to discover,
he saw that there were craters on the moon, he saw that Venus had phases,
he saw a lot of things that convinced him that the earth was not the centre of the solar system,
that in fact it was going around the sun, and the whole planetary system was going around the sun,
he started this whole sequence off.
And so we have been going down a path that Galileo pioneered,
he did a lot of things about pushing the scientific method forward,
that is he started talking about the laws of motion and about consulting nature
about what is the correct thing rather than going to authority and so forth.
And he wasn’t the only one but he pushed it very far and got himself into trouble that way too.
But the combination of thinking rationally about things, going to consult nature,
building tools to investigate is really the basis of modern science and allows us
to think we can find solutions to the energy problem or other problems that go on,
because we’re discovering more about the world and then how things work in the world.
Ok, well, in 400 years we’ve made a little progress with telescopes, we have telescopes in space,
John Mather told you about the next generation space telescope,
but there’s even another telescope that was launched last year, the Kepler telescope,
which is on a search for extra solar planets.
And we found 455 so far, but with Kepler we’re expecting to find another magnitude more than that, and they published 5 so far.
But this is a picture that I find interesting, that’s why I had them turn the lights down and hopefully you can see it.
This picture is remarkable to me because it was taken in what was relatively blank field of the sky,
and with just a long exposure with the Hubble space telescope,
and the first thing that I think is remarkable about this picture is that it has only 4 stars in it.
So this is a star, this is a star and this is a star and there’s one more here somewhere,
I can’t see it from this angle, and how do I know they’re stars,
well I know the secondary of the Hubble telescope is held up by 4 struts,
and when a star is small enough you get diffraction off of it, so you get this little pattern.
If the thing is finite like this object, right, this is just blurred, the star is blurred out because it´s so bright,
if it´s finite like this object you don’t see that little cross, you don’t see that kind of thing,
and you can recognise that this is what we call a galaxy, and you’ll see there is many galaxies in this picture.
In this picture there are more than 1000 galaxies,
so for every star we happen to see out there there’s at least one galaxy in the background.
That’s an impressive thing, it makes you realise what a tiny fraction of the sky this is,
because we know there are about 400 billion stars in our galaxy, and if we take our telescope
and we look at any star we’re going to see galaxies behind it,
so that means there’s more than 100 billion galaxies that are visible in the universe.
So the first question that you should ask yourself is where did all those galaxies come from.
If I was an anthropomorphic person or giving the argument that the universe was created just for men to have a nice abode,
I’d think the solar system was enough, but certainly one galaxy would do, you know,
why would I need billions, hundreds of billions of galaxies?
Well, it turns out it´s cheaper to make it that way but that’s another question, you know,
it depends whether god was on a budget or not, but it’s a little tricky.
But if you're going to be a cosmologist and explain the world,
you’ve got to explain why there are so many galaxies and why they’re distributed.
And you’ll notice another thing, you’ll see there are some galaxies here which are the same colour as the sun,
a typical star like our own sun, and there’s even one here that’s clearly a nice elliptical galaxy,
it´s very much like our own galaxy, so you’ve got to wonder is there a Lindau meeting going on
and are people wondering what's going over in that galaxy, you know, or how is the universe made.
But if you look behind it you see a lot of faint blue and white smudges,
so I can remember when these were first being discovered, one of my colleagues discovered this
and we were quite amazed, because we know the universe is expanding, the universe is expanding,
the light from a more distant object is stretched more to the red because of the expansion of the universe.
So if this is a nearby galaxy and it’s nearby because we can make estimates of how far it is,
but just the fact that it’s larger, here you can resolve it, means it’s probably more nearby.
And just because these are nearby and they’re kind of yellow and the ones that are blue and white behind it,
that means they’re hotter and it means they’re a lot hotter because they should be shifted to the red,
and they are shifted to the red compared to what they originally started.
So not only do I have a lot of galaxies, but clearly the galaxies are changing with time,
why are they changing with time, well, because the light takes longer to get here from the more distant galaxies,
and so I can see that evolution.
And the reason we think these are blue and white is we think there’s a lot of massive star formation going on
in the early stages of the galaxy, and those are very bigger stars, burn bright and hotter and they use up their fuel faster.
And only the stars that are burning slowly, which are kind of yellow in colour,
are the ones that last long enough to be in the more modern developed galaxies.
So already just looking at this picture and thinking about it a little bit, you realise you have a lot of things to explain.
First there’s 100’s of billions of galaxies in the visible universe and how are they distributed and how do they evolve,
where do they come from, because they obviously haven’t been there forever, because there would be an energy crisis,
they’d have to have a source of fuel that would last forever and I claim with accelerating universe you have a problem with that.
Ok, so how are we going to deal with this?
Well, luckily we have a cosmic scene investigation primary tool, so we’re on the scene of the crime
and we’re looking at the clues, just like the forensic people,
we’re having a look at the relics and try and reconstruct what happens.
So the primary tool is the fact that the universe is extremely large,
because it’s extremely large, there’s an optical delay line that lets us see the past.
So we can imagine we’re here on the earth and if we look out to the sun and take a photograph of what's happening on the sun,
it´s actually a photograph of what happened 8 minutes ago.
Well, 8 minutes isn’t so long, if you´re making a phone call that goes to a satellite, up and down, it’s a little delayed,
it´s annoying, but its not so bad.
And even to the moon it would be very annoying, but 8 minutes to the sun is annoying,
but if you´re just taking a photograph and studying it, well, 8 minutes is no big deal,
unless the huge solar flare is coming and it´s going to disrupt your communications or something.
Or if you’re an astronaut trying to go to Mars, you don’t want to die because the solar flare came,
you want to put up your shields or whatever.
But that’s really nearby, it takes 40 minutes for light to get to here from Jupiter.
Already at the end of the 1800’s people were having to make allowances for the speed of light
in order to use the moons of Jupiter to tell where they were on the earth, as part of the navigation,
because depending on where you were and what the timing was, where the moons were gave you a different kind of a clock.
But if you go out to a typical star, say the nearest 50 stars, it takes light about 10 years to get here.
Well, that doesn’t seem so bad, but if I take a typical star in our galaxy,
it takes the light 1000’s of years to 100,000 years to get to us, that’s just our galaxy, right.
So if I take a picture of an interesting object, so there’s some famous stars out there
that are in their red giant phase and are probably going to go supernova.
They could have already gone supernova, but the light hasn’t got to us yet.
We can keep watching them until something happens, if we had the patience.
Humans time scale and the universe time scale are extraordinary different,
so usually we can’t put a student on watching that star forever, right, because it could be 10,000 years,
a very short time for a star but for a grad student it´s not so short.
But, you know, if I go and I look at the nearest large galaxy to us, it takes like 2 million years.
If you took a picture of the earth 2 million years ago, not only would you not see the great wall
or see Lindau or anything else, because there were no humans, right,
that’s the time on the chart you saw before when the first humanoids started appearing.
So just our very nearest galaxy, the Andromeda galaxy, it takes light 2 million years to get here.
So you take a typical kind of galaxy out there, go out to a greater distance, the typical kind of galaxy,
you would expect to see 100’s of millions of years to billions of years, and if you look as far as you possibly can look,
we look back a distance, we estimate almost 14 billion light years,
so that’s very near the beginning of the universe, and the universe is much smaller.
I’m showing you on the outside because even though it´s smaller it could still be infinite,
this is just how far we can see, then we can make a map of what the universe looked like when it was very young and very hot.
And we can’t see further than that because it´s as hot as the sun.
If it’s 1000 times smaller then it’s 1000 times warmer than it is today, it would be as hot as the sun,
you can’t see into the sun because it’s ionised, you can see to the surface of the sun,
you can’t see down to the core, directly with light, there’s another way we can kind of do that.
So our goal as cosmologists is to map all this accessible region,
we can map, light can get to us from here, right down to the present.
And if we have a technique we should be able to map the entire inside
and by sampling on each of the spheres we’ve got a sample of the universe in each of its epics,
it´s like suppose that someone came ahead of you and they wanted to learn about how trees grew,
so they made the first field and they planted trees in it, a year later they came to the second field and planted trees in it
and so forth for 100 years and then you can just go by and see here’s trees that are 100 years old, 99 and so forth,
you get a sample.
And we can do the same thing with the universe and the question is, well, how big a sample can we get,
how much information can we get and does it tell us everything we need to know about what goes on in the universe.
And the answer is it tells us quite a lot and we can see.
So here’s the recap:
We live in a spiral galaxy, we happen to live in one of the spiral arms in our spiral galaxy,
so I guess this is the centre of the picture, we live about like that,
we don’t live in the centre of the solar system, we don’t live in the centre of the galaxy
but we draw this imaginary sphere of time around us and if we look we will see galaxies around us,
and you will notice these are mature galaxies, they’re elliptical galaxies or spiral galaxies,
those are galaxies that have come to some kind of statistical equilibrium.
And if you look further out, you will see irregular galaxies with star bursts and stars forming,
they’re blue and they’re white, so they are the bright stars, many of these will merge together
and then the system that relaxes becomes one of these more mature galaxies.
But the fact that it´s elliptical or the fact that it´s spiral, means that some relaxation has gone on,
that the stars have come to more of an equilibrium,
the fact that it´s irregular means it´s still forming and still quite active in what's going on.
Now what's wrong with this picture?
Let me show you the full blow-up.
What's wrong with this picture is inside of this volume there should be the 100 billion galaxies, a little hard to draw,
so you have to imagine there’s a really large number of galaxies there.
And out here is the beginning of time and out here is, as far as you can see, it´s like the surface of the sun,
but it’s the surface of the universe, the photosphere of the universe.
And so that’s the idea, there are cosmic spheres of time
and there’s a time period between when the universe gets cold enough for neutral atoms to form until the first stars turn on,
and then the stars and the galaxies start accumulating, sort of a bottom-up, kind of merging together,
and you get larger scale structure and more mature things till later in this time period
you start having the second and third generation of stars and we can have our solar system.
So I have spent a very large fraction of my career studying this last surface, which turns out to be a difficult thing to do,
but somehow or another people have managed to let us have a lot of money and build fine instruments to do it,
but let me give you a brief history of looking at the cosmic microwave background.
It´s called cosmic microwave background because now it´s microwaves, back early in the universe it was optical light.
The time when we were mapping, the period we were mapping from, but the universe has expanded 1000 times since then,
the wavelengths have stretched 1000 times so it´s gone from being visible light to being in the microwaves.
So Penzias and Wilson, who are here, I guess they’re not in the room,
but who are here at this conference and are giving talks, worked with this antenna.
And they were hired as radio astronomers by Bell Telephone Lab, as a result of an experiment that Bell Telephone did
and just before 1964, that is they put something called the Telstar satellite in orbit
to see if you could send signals from the ground up to a satellite
and then broadcast that back down to the ground and capture it again.
And if you could do that then you could make money, because you don’t have to lay underseas cables,
you could send telephone calls and radio, tv programs across the ocean by simply sending it to a satellite and back down,
but you could also run satellite phones and as you know that was a successful experiment,
but before they knew it was going to be economical or not, they needed someone to go and measure how bright the sky was,
because if the signal to noise ratio tells you how many channels of communication you can have,
and the more channels you can have the more customers you have, the more money you can make.
And satellites were not so powerful in those days.
So they had built this antenna to see if they could see the signal.
So this is quite a large antenna, this is roughly 20 metres across and, I can’t remember whether it´s 7 metres or 20 metres,
in the Deutsches Museum in Munich the actual receiver for this is on display.
So they built this antenna and they hired Penzias and Wilson, and they said measure the brightness of the sky,
and Penzias and Wilson say there isn’t going to be anything interesting there,
we know there’s nothing interesting, we want to measure the 21cm line and map what the galaxy looks like.
Well, anyway you’ll probably hear more and more details of that but their bosses were on their backs,
so they said let´s just show them that this is easy and they’ll leave us alone,
we’ll take the very fancy receiver that they had built and make a 7 cm wavelength
and make a measurement of the brightness of the night sky and they did,
and had they mapped the whole sky they would have got a map that looked like this.
This is the whole sky just rolled out flat, but it’s a sphere and there’s a plain of the galaxy,
so we live in a spiral galaxy, it’s a pretty flat plain, we live in a spiral arm
so this is looking down the spiral arm one way, looking down the other way and the centre of the galaxy is there.
They would have measured a sky that looked like this.
This is something about 3 Kelvin, they guessed 3 Kelvin but it was 2.7 when we measured it a little more precisely.
They would have measured a sky that looked like that and everybody was happy,
they got the Nobel Prize and they get to come to Lindau, meet the students.
And then in 1989 we launched the cosmic background explorer satellite to measure the spectrum of this
to see if this truly was the relic radiation left over from the Big Bang and to make a map of that surface.
And so in 1990 we announced that it was the right spectrum, John Mather told you about that this morning.
And in 1992 the team that I led published this map and this is, we have 2 different versions of this map.
This is a map of the microwave sky with a lot more resolution.
There is in here, this structure of the galaxy is now saturated because we’ve blown the scale up by a factor of almost 100,000.
So these variations that you see off the plain of the galaxy we were able to show,
because we had multiple wavelengths, didn’t come from the galaxy but came from the universe.
There’s groups of cool regions together and groups of warm regions together,
we were able to show that came from the early universe itself directly.
And that if we blank out the region from the galaxy we can see that there are long wavelength variations,
so it´s cool here and warm there and then there are short wavelength variations on top of that, things on every scale.
And we said, aha, this is the discovery of anisotropy, here we were having limited, a scale of 7 degrees,
and so we were able to measure at a part in 100,000 that there were there variations.
So the incredible thing is the universe is unbelievably uniform.
But it´s kind of boring to see a sky that looks like this, when you take the galaxy out there’s nothing but a uniform glow.
The thing that we find really interesting are these small variations.
We find they’re interesting because they’re going to be the things that turn into galaxies and clusters of galaxies
but they’re also the thing that tells us about how space and time itself perform.
We can look backwards and we can look forward because if you know in physics, if you have a boundary
and you know the boundary conditions and you have the equations of motion, you can go backward and forward
and as long as there’s a linear theory you can calculate the correct answers, that’s the key thing.
So in 2000 the map satellite that became WMAP satellite, named after Dave Wilkinson,
who was a member of our original COBE team, was launched, and it now has bigger antennas that collect,
and therefore better angular resolution, so you see the galaxies saturating along here,
you see the cool regions that match the cool regions and the warm regions that match,
but now you see more resolution of what's going on.
And recently in May of 2009, so just about a year ago, we launched the Planck satellite
which took 3 months to get out to the co-moving point with the earth and the sun system.
So it´s like a geosynchronous satellite but it doesn’t stay fixed above the earth,
it stays in a fixed relationship between the earth and the sun, so that we can keep the sun and the earth in the background.
It took a long time to get out there, we’re mapping and soon we’re going to produce the map that has 3 times the resolution
and better sensitivity, and where soon is, the first map is going to be released on Monday,
so I’m really sorry I can’t show you, but I don’t have it so I can’t show it,
but I’m not allowed to show it to you until it´s released.
But very soon you are going to see something that’s to the factor of 3,
very high resolution and more sensitivity and more wavelengths.
So why do we go through the trouble of mapping this in more and more detail?
Well, it´s like your baby pictures, your parents like to have it.
This is the embryo pictures of the universe, but more than that it really unlocks a lot of secrets about cosmology.
So let me go and explain that a little bit.
So here’s the real data with the galaxy removed, but in this case actually the galaxy is not removed, this is on a linear scale.
This is actual data, on a simple linear scale, so you see the 2.72 Kelvin radiation,
you see it doesn’t vary very much on a linear scale, this is the same scale we normally use.
Here’s the sun on the same scale, 2 photospheres, one is a sphere that you’re looking into,
the other is you´re inside the sphere and you’re looking out.
So you’ll notice the sun is extremely uniform but not perfectly uniform on this linear scale
and if you measure it very precisely, I’d had to cut it off some,
it’s a little bit bigger in diameter in this direction than in that direction because it’s rotating slightly.
Now, the universe isn’t, so we can tell the universe isn’t rotating, even very slightly, if it´s rotating it´s very little,
but when we blow up the scale a factor of 100,000, then you see this sort of a map
and you can see again what I’m telling you, you see lots of blue areas together, lots of red and yellow areas together.
There’s the structure on multiple scales.
But you’ll also see if you can do careful analysis with your eye,
there’s a particular angular scale that’s picked out here, and that’s kind of interesting
because it tells us something about how the universe was formed and what it’s made out of.
So you can compare that to a higher resolution map of the sun and you realise that physics that’s driving the early universe
and the physics that’s driving the surface of the sun is very different.
It turns out that the early universe is extremely more linear than the surface of the sun,
you can clearly see what we know are magnetic fields from looking at the spectra,
you can see large scale structure but you see sharp features and so forth.
You see sharp features here but they don’t extend over any distance.
This is a sort of a scale, it’s a lot of independent things, there’s no coupling of the modes,
which means there’s no non-linear in the system.
I’ll show you another example of this later on, so you can see.
So the sun is pretty simple, it´s pretty spherical, it´s pretty much,
but it´s got complicated stuff going on when you look at it in fine detail, and I’ll show you a movie of the sun.
So here’s a nice movie of the sun, and what that is is sound waves,
the sound waves travel through the sun, the sun is almost a beautiful musical instrument,
that is it´s resonance is very good, so if you could excite just a single note you would have a very pure note.
But in fact, many notes are excited, here’s what the sun sounds like, although I don’t have the speakers,
no, I can’t hear it, so if I can’t hear it you can’t hear it.
Ok, but what we can do is we can look at this very carefully, there’s satellites, so you can watch the sun
and you see this movie and you just analyse it as a function of time and see how the different notes are going on.
And this is called helio-seismology, that is measuring the sound waves in the sun,
and you divide it up into the normal modes of oscillation, so I have one equation in here
which is the natural thing for a spherical thing is use spherical harmonics,
and you can sum up the apparent brightness or temperature of the sun as a function of angle on the sun
and coefficients of these spherical harmonics.
And you can plot those as a function of how much that coefficient varies with time.
So here’s one of the modes, L = 100, M = 100 mode, and you can see it doesn’t stay at a constant ringing,
it’s actually exchanging energy between the various modes, right, so here’s an example of how it looks excited.
And if you make a plot versus L, versus the frequency at which these things are operating, you see these families,
these families of curves that go like that, there’re various things, and the reason for that is the sun is rotating,
and so if a sound wave going in the same direction as a rotation to get around the sun
takes a different amount of time than when you're going against the rotation or if you're going north-south on the sun.
And so there’s various aspects of this, but the thing that it´s used for is studying the interior of the sun,
we can’t see into the sun with light but the sound waves travel into the sun,
and the speed of sound has to do with the density and has to do with the temperature.
Remember, the speed of sound has to do with the speed, the average speed of the molecules,
which goes as a recorder of the temperature and so forth, so you can actually probe
by looking at the modes that go through the centre of the sun,
you can probe the temperature and the density at various points of the sun so you can see if you understand what's going on.
So you’re able to look into the sun by using the fact that sound waves come to the surface
and that light carries you images of the sound waves, so that you can see what's happening.
And so people have been doing this for quite some time, so here’s an example of,
this is of course in millihertz, so to hear it you have to shift it up into the audible range,
but you see the set of things that go like that, and every now and then a comet will hit
and it will make some low frequency noise that damps out, and the pure modes are left behind
and they excite but they couple to each other.
And so the sun is actually more complicated than the universe, which the helio scientists think that’s cool
because we were having trouble understanding the sun in great detail.
But the early universe isn’t completely trivial, there are sound waves and these sound waves come
until the surface of light scattering and they make this set of peaks and these sound waves are simply sound waves,
you put a perturbation, a tiny perturbation in your universe and the pressure carries these sound waves through the universe
and they make little spots on the scanning surface and we bring the images.
So it´s like taking the sound of an embryo, you can take the sound from the surface and take the light that comes to you
and then turn that into a picture, you can then project back
to see what the sound waves have been doing through the history of the universe.
So the interesting thing about the early part of the universe is that the primary carrier of the sound is light,
with a scattering of light,
so the speed of sound is the speed of whatever the object is divided by the square root of the number of dimensions,
which happens to be 3, so the speed of sound in the early universe is the speed of light divided by the square root of 3,
it´s roughly 60% of the speed of light.
And so you can actually calculate how the sound waves travel and what goes on.
So then what we can do is the same thing that I did before, I showed you the power spectrum,
that is what the frequency versus the various L, but because the universe isn’t rotating,
I don’t have to worry about there being different speeds and different directions,
so I can collapse it into a one-dimensional kind of a thing.
And what I see, what you see is, there’s a little flat shelf which is sort of suppressed here
and there’s a first rest of peak, the first thing that you see, which is the kind of size of the peaks you saw,
and so if you remember back to that map I showed you with great detail, this is one particular angular scale,
that’s picked out by a factor, this is power so you have to take the square root of it,
it´s about a factor of 20 above the average of what else is going on.
So there’s a certain scale size, peak size that’s picked out, and then the harmonics of it,
because it’s a physical thing, you can see the first peak, the second peak, third peak, fourth, fifth, sixth
and maybe the seventh if you believe it.
And here are the data we’ve collected, this was up until recently, and now I’ll show you in slightly more detail
what’s going on, this comes from the satellite and this comes from various ground and balloon based experiments,
we’re measuring the spectrum out and we’re measuring out to an angular frequency
where there’s 2000 waves across the sky in different directions.
So we’re starting to measure the thing very precisely.
So here’s the most recent data, this is the seventh year of WMAP data, this was from earlier this year,
this set of data released, but you can see sort of the flat region of primordial stuff and then this first peak
and the second peak, this is on a logarithmic scale so it suppresses things in a sort of a funny way.
Ok, so what can we learn from this spectrum?
Well, it turns out that we can learn a lot, it´s very similar to seeing the spectrum of a star
and you can figure out what elements are in it,
here we can begin to understand things about the geometry of the universe and about the composition of the universe.
So here’s some example, here we don’t have so many universes to compare in the lab, we have to use computer models,
so we can say, what if we change the total curvature of the universe or, if we believe general relativity,
the total amount of energy compared to the critical energy to make the universe flat.
Well, what we see is, as we make the universe more negatively curved, this whole curve shifts to the right
and if we make it more positively curved, like a closed sphere, it shifts to the left.
So if we can measure where this first peak is accurately, we can measure the geometry, the flatness of the universe.
So we’ve done that, now we’re not so sensitive to dark energy, although in second order
we’re getting precise enough where we’re able to learn some stuff about the dark energy which is the thing we see causing that.
But here’s the part that’s sort of interesting for the particle physicists, the baryons,
that is the stuff that’s in this room, the baryons are the protons and the neutrons basically.
If you change the amount of baryons, if I increase the amount of baryons, this first peak goes up,
the second peak goes down, the third peak goes up.
It´s just simple physics because it’s the electrons which are coupled to the baryons that are coupled to the photons
and causing the oscillations, so it´s easy to see that.
But if I add dark matter to it, the first peak goes up, the second peak goes up, the third peak goes up, alright.
So all I got to do is measure the ratios of the peaks and I can measure the ratio of the baryons to the ratio of the dark matter.
And I have an independent check that there’s dark matter, independent from the bending of light
or the other things that I have, because this is a physical oscillation as opposed to, you know, recoverage or something.
So I’ll show you the example of that and then I’ll show you some numbers.
So here’s the measuring of curvature of space with WMAP simulation or animation.
So imagine that you’ve measured, this surface looks like that and space is flat,
you just project to your satellite in straight lines and you make an image, one to one true mapping.
But suppose that the universe is possibly curved, then what happens is that it makes the spots bigger and further apart.
It also shifts their level a little bit and if it´s negatively curved, it´s saddle-shaped or a funnel that’s growing apart,
you get that, so by measuring and comparing these patterns with the patterns you measure on the sky,
you can measure the geometry of space, and what we find is that the geometry of space is extremely close to flat
and we measure that in terms of how close we think the density is to the critical density
but we’re really measuring the flatness of space.
And so here’s where we were in 2003, and now where we are in 2010, we can measure the current expansion rate of the universe.
In 2003 we thought it was 71 plus or minus about 4, now we think its 70 plus or minus 1.7,
so the reciprocal of that is the mean doubling time or the size of the universe,
so it´s on the scale of 10 billion years, so it gives us an automatic scale.
But if we look at the density parameter, which is we measure the flatness,
the density parameter exactly 1, we would say the universe is perfectly flat.
Well, we measure 1.02, plus or minus 02, back in 2003, now we’re saying it´s .994 plus or minus .01,
so it´s consistent with flat but it could be slightly negative or slightly positive,
we don’t know quite yet, it depends on what we’re drawing.
But if we measure the total amount of matter, the density of all forms of matter in the universe,
we find it´s 27% of the critical density.
So we know the total density, if Einstein is right, the total density is 1, but only .27 comes from matter,
that means .73 comes from something else, which we call the dark energy.
But we can also fit to how much is made of ordinary atomic matter, and that’s 4.5%.
So the stuff that’s in this room is no more than 4.5% of the material from which the universe is constructed,
it´s pretty simple in this kind of calculation.
There are other pieces of evidence like that but this is a straight forward sort of calculation of that.
And so we can go down and do some of the other things, so we can then calculate what's the age of the universe today
and we get 13.7 plus or minus .2 billion years, so we’re starting to get...
So the interesting thing was we can calculate to what factor the universe was smaller at the time the radiation came to us,
and the answer is 1089 plus or minus 1, and it was an epoch which we calculate was roughly 380,000 years after the beginning.
That seems like a long time, but remember the universe is almost 14 billion years old.
In terms of the ratio of your life that would be 6 hours after conception, that’s the scale factor.
So 6 hours after conception is when the cell is thinking about dividing, still equivalent to 1 cell in a human.
If it was me it would be 2 cells because I’m twice as old as you guys, so twice as many cells.
So we’ve had this history, cosmic microwave background,
which are revolutionising our understanding of the universe at an incredibly early time.
In ’81 we launched the COBE satellite, 2000 the WMAP satellite, 2009 the Planck satellite
and we’ve made improvements in angular resolution and in terms of having the right wavelengths
and with Planck we’re supposed to go that way, and the smudgy part is that we’re going to be measuring polarisation too.
And you know when light is scattered by electrons or off the surface, it´s polarised slightly,
so you get polarised sunglasses, the light scatters off the hood of your car or off a lake,
it´s lined up so that that light is blocked.
And so the same sort of effect is going to happen in the early universe if we have these small temperature variations
they cause small polarisation variations at roughly 5% level, makes them difficult to measure,
so these smudges are really not smudges, they’re little arrows representing
how big the polarisation signal should be for that, and that’s one of the things we’re trying to map.
So we’re having this era of great discovery, just like we had the era of the great navigators and explorers of the earth.
We’re now discovering the early universe, so we made this sort of course map of the universe with COBE
and if we flipped it over we had made this map, you’ll notice that Europe hardly shows up here
and Florida doesn’t show up at all and so forth.
But all the continents are there but not much else, right.
And with WMAP, well, on the screen here the resolution isn’t so good, but with WMAP we sort of have a much higher resolution,
with Planck it will be another factor of 3 higher, we’ll have the equivalent of having a map here.
So imagine it´s 1800 and you have this map, you could be a really good geographer, you could also be a great geologist,
because look at the difference between this map and this map, it’s very easy to see this shape
and the mid Atlantic ridge and this shape, clearly the continents were moving, right.
It was controversial until this, until the previous century that the continents actually shifted around,
now it´s absolutely positively clear, but we have a map like this you sort of see that in a lot of detail.
You don’t have problems picking out, you probably could see Lindau in this kind of picture.
But look at this, there’s a sharp feature that extends over a good fraction of the earth.
How can there be a sharp feature that extends over that kind of a thing?
You don’t see any sharp feature like that in the early universe.
And that’s what I´m saying, it´s again the evidence that the early universe is extremely linear,
it doesn’t couple modes, whereas these processes that deal with the surface of the earth are non-linear
and it couples modes, so small wavelength things get lined up with large wavelength things
to make shape edges over extended period.
So already from just make this map we not only know the seeds of how a structure is going to form,
but we know when space and time itself were constructed, it’s an extremely linear process,
we know it´s linear to a part in 10 to the 4th, so we’re making measurements now to a part in 10 to the 9th,
your fluctuations are 10 to the minus 5 and we know they don’t have any non-linears in 10 to the minus 4.
We’re really pressing our luck here, we’re putting a lot of effort into this.
Ok, so we first had a map at 7 degrees, then we have a map at 3/10 degree,
next week we’ll have the beginnings of the first generation of the maps that are 1/10 degree,
and at the same time there are 2 big ground based telescopes, the Atacama Cosmology Telescope up on a high mountain,
it´s not quite the peak, it´s on a sort of a pass between 2 peaks where it’s a big flat, sort of an area,
but it´s over 5000 metres, the Atacama Cosmology Telescope, it´s quite a large telescope.
And at the South Pole, which is sitting on 2 kilometres of ice, so it´s reasonably high altitude,
is the South Pole Telescope which is slightly bigger, it´s 10 metres in diameter,
but it´s at a place where it´s very cold and there’s very little water vapour,
so it has the equivalence of being at 5000 metres, and it´s making measurements of the sky
with an angular resolution of 1/50 of a degree, but it can only map a part of the sky,
because you can´t observe the whole sky from a fixed position on the earth.
But in addition to that you begin to see some shadowing effects and some signal effects,
so you see not only these original fluctuations that you see here,
but you start seeing these other features which are actually clusters of galaxies.
The CMB backlights clusters of galaxies, you can see any cluster of galaxies in the universe
if you’re able to look at this backlight.
So we can do another inventory of what's in the universe by making these kinds of maps
and so we’re investing a huge amount of effort to make the primordial measurements
and to also make these secondary measurements just using the light from the beginning of the universe
as the tool to probe the structure of the universe.
And when we’re doing that we’re coming up and testing this model which has grown.
So again, the universe is actually 3 spatial dimensions and 1 time dimension that are large,
and so this represents, this circle down here at the end, this circle is a slice through the sphere that surrounds us
that we can see, that should have the 100 billion galaxies inside of it, and then you just follow the envelope back in time,
you can see the envelope was increasing, it´s increasing with time,
it was increasing all along but slowing down during this phase.
Our solar system was formed right about here, the universe started and expanded more rapidly a little before that,
but the first generation of stars was happening at about 400 million years,
and then there were forming the first stars and the first protogalaxies,
and they’re merging and forming the more mature galaxies.
And here is this last scattering surface, but we’re thinking we can extrapolate back to the time
when everything that’s in our visible universe, all, you know 100 billion galaxies plus,
were in a region that was smaller than an atom.
So it’s a very impressive kind of extrapolation that we’re talking about,
and because of that quantum mechanics is going to be very important here,
and the imprint that quantum mechanics made is left here and it´s also left here,
our own galaxy was a quantum mechanical fluctuation one time,
the clusters of galaxies nearby they were quantum mechanical fluctuations too in this picture.
So it’s an interesting picture that says there’s a direct link between these macroscopic things,
and the microscopic things that you go on and can study and other things.
So while we’re doing this we haven’t been neglecting the rest of the universe, well, only some.
I put a lot of my effort in that but there have been plenty of people trying to study the distribution of galaxies.
So this is a Sloan Digital Sky Survey, it’s a map of a million galaxies,
so they just go out with a telescope and take a picture, throw away the stars,
they have little pluses on them, so you can throw them away, the things that are left are galaxies,
you estimate their position on the sky, from the angle on the plate compared to the stars,
and you estimate their distance away by taking their spectra
or by using some other indicator of how far away they are, and you make a plot.
And if you take photographs as the earth rotates, you get a wedge across the sky,
so you see in green a wedge and every dot on here is a galaxy.
And the galaxies seem to fade off when you get far away, that’s because they’re too faint for that small telescope to see,
it’s only a 4 metre telescope, you know it’s as big as they could afford.
And if you point to a different angle you get a different wedge across the sky,
and the part of the sky that’s blocked out by our own galaxy, the dust and so forth around it.
Now let me show you a movie of these.
The first thing you will see is the geometry of the survey, the wedges,
the next thing you will see is the galaxies are not uniformly distributed at all, right,
there are big voids, quite large voids, places here where there are no galaxies at all,
and other places where there are large groups of galaxies.
And there’s one feature that’s quite conspicuous here, this object, we call this the Great Wall,
it´s not just a line of galaxies, it’s a whole sheet of galaxies, so like the Great Wall in China,
this is the Great Wall of galaxies, and it probably has about a million galaxies in it, we’ve only sampled it so we don’t know.
So one of the questions we have in cosmology is, how common is an object like that?
What are our chances of being near a sheet of 100 million galaxies?
If you were sort of arguing based on probability, we should live in a huge cluster of galaxies
because there’s a lot more galaxies to be in than being in a small cluster of galaxies.
But, you know, doing this kind of all, it´s after the fact statistics and that’s always a little tricky.
So this is the Sloan Digital Sky Survey, which is primarily US-driven, although there´re some European collaborators,
there’s a second group, most of Europe, which has also done a survey,
and we’re going to do a fly through, hopefully you guys can see this.
Now remember it takes light 2 million years to get between neighbouring galaxies, so we’re going really fast.
And you will see though, sometimes you see spiral galaxies, sometimes you see elliptical, sometimes you see the colour.
Whatever the information is there, it´s in the catalogue and then you can reproduce it in this kind of thing.
Now we’ll swing out and look back and you’ll see the geometry of this survey.
There’s a lot of galaxies out there.
So now you can see the wedge, because look where the telescope, you see a cone
but if you drag the cone across the sky you’ll see a wedge, and again you see the voids
where there are almost no galaxies and then clusters of galaxies and here’s another piece of the Great Wall that’s out there.
So in the early days, when people were doing this, they used the redshifts of the galaxies,
and when you saw a cluster of galaxies, the internal orbital motions of the galaxies would cause elongation,
and so they started naming these things the Fingers of God, because they were all pointing at us.
And then there was this “stick man”, which was the set of galaxies which were all elongated and made it look like that.
So we’ll see.
So how does this come into being?
I showed you the early universe is incredibly uniform, variations are only a part of 100,000,
and yet the late universe is full of galaxies, how do you make that change?
Well, we think we understand that, you simply put in very tiny perturbations and you let gravity work for 14 billion years
and you see what you get.
So I’ll show you first a simple simulation, I hope it will work.
So the universe is expanding and you see it expand,
but you see where there’s local extra concentrations the matter lumps together and sort of clumps and so forth.
So even though the universe is still expanding, you find little things that lump together
and they merge together to eventually form a galaxy and sometimes a cluster of galaxies,
depending on what scale you’re talking about.
So now I’m going to show you a similar accentuation, but now instead of letting the universe expand
I’m keeping the box the same size, I keep rescaling the box, so you can see what's going on, because you put in the variations.
The first thing that happens is the high peaks show up, and then the high peaks sort of form together in a web,
like a spider web, but a messy dirty spider web and they get linked together.
So if you watch it, I hope it will recycle, if you watch it, first you see just the peaks,
there’s statistical fluctuations that are five/ten deviations, they show up first, just the peaks, and then the network forms.
You take the matter, which is going to be distributed and then collapses down into sheets and into fibres,
into filaments and you end up with this sort of a web shape sort of a situation.
Now this is a simulation, that’s only dark matter, that is you only put in the dark matter, no radiation,
no anything, it´s just gravitational attraction, and the perturbations and you do that.
Now what if you put ordinary matter in with the dark matter and run a big scale simulation,
you're going to see that when you look on the very large scale, so a gigaparsec is 3 billion light years,
so this is 3 billion light years, this distance is 5 billion light years, so 1/3 of the way across the universe.
As you zoom in you're going to see the different structure, I can’t tell whether you can see enough resolution or not.
Now I’m going to show you a zooming to some Millennium Simulation and 10 billion particles,
so 5 billion light years across now, it looks pretty uniform, but it kind of looks organic,
you can tell it´s not a rigid structure, it’s a statistical process and it forms these filaments and structures
and you have these voids.
And where many filaments come together, you get a cluster of galaxies or a large cluster of galaxies,
so this is zooming in on a place where many, many filaments come together,
where there’s probably 100,000 to a million kind of galaxies, so it does happen.
The people who run the simulation, you know, you want to go to the big shiny object, right, so that’s what the zooming does.
In this simulation the dark matter is shown as white and the ordinary matter is shown as yellow, like stars,
because you don’t see it until it turns on to a star.
The interesting thing is the dark matter doesn’t interact electromagnetically,
so it can’t dissipate enough and collapse, it leaves halos.
But the ordinary matter can interact electromagnetically,
can reinject some energy and collapse to form the stars and the galaxies.
So we’re in here, this is sort of a distance between us and Andromeda, so if we were living in a place like this,
there would be galaxies wherever we looked in the sky, I mean you could see them with your naked eye.
But when you zoom out, you realise it´s great to be like god or a simulator, a theorist,
because you get a feel for what the universe looks like.
But if you lived in the universe and you had to fly through it, it’s very different.
So remember the white is the dark matter, it forms the halo and then inside the halo you see the cores,
the galaxies where the material is collapsed.
But when you´re flying around in here, it´s hard to get a feel of what this structure looks like,
because you just see variations and variations and variations, you don’t see that on the large scale,
it sort of averages out together to be something very significant.
So here’s another example of the history of the universe.
So here we are here and now and if we let light come to us it comes along a light cone
so we’re looking at a wedge where we’re seeing what's going on.
At the beginning of the universe, the universe is very uniform but very warm as it expands and cools down,
once it cools down it reaches the point where there’s decouple and matter beginning to clump.
Once you turn some bright stars on it re-ionises the matter around it and makes the universe more transparent,
and you start forming up more and more structure, so you eventually get the cosmic web here.
So let me show you without all the labelling on it, so it’s a little easier for you
to see the variation we’re talking about, how smooth it is towards the beginning of time,
back when the universe was 20 times smaller, to how irregular it is in the present.
So here’s your look back time in billions of years, so you can first of all go back 13.7 billion years,
this is the kind of structure you would expect to see.
Now this is dominated by the dark matter, but you can test the light matter,
so there’s an experiment on the Hubble Space Telescope where they’re looking for the cosmic web
by looking at the light from a quasar and then looking at the light that’s absorbed by the hydrogen clouds along the way,
you see lines get added, you can see by the redshift, you can figure out what the distribution is,
if you uncover it you can then look back and try and figure out what's going to happen.
That tells you what the ordinary matter does, you’d like to know what the dark matter does.
So we go back to Einstein again, and we say, oh, light comes to us, but if there’s some material in between, light is bent,
so imagine the light rays going around the cluster of galaxies that’s dominated by the dark matter,
remember there’s 5 or 6 times as much dark matter.
And when you do that you see that you will find the background light is lens and if this is a straight line,
in a straight line, let me show it again, if the source and the lensing object
and the viewer are all in a straight line you will get an Einstein ring,
if you´re slightly off you’ll get part of the ring, otherwise you’ll just get a distortion.
So you see there’ll be a ring and if you look you will see further out here, around the edge, you will see the sections of ring.
I don’t know if the resolution of the thing is enough, but you see lenses, you see rings.
So in a strong cluster you will see very strong lensing, as you get further out from the cluster,
the lensing gets weaker, if you get fairly far out on average,
you get the shape of the galaxy just stretched by just a couple percent, that’s the typical kind of thing.
So you can then try and do the reconstruction.
So you take a section of the data, a cosmos is something that’s on the order of between 2 and 4 square degrees,
depending on how you do it and you take, and divide your source light and the stuff that’s 6 ½ billion light years away,
the light that comes from far away has to go through all the material,
the light that comes from nearby goes through a little bit and you subtract it off, you do a deconvolution,
same thing that people do in medicine, to try and figure out what's going on inside,
and then you can try and reconstruct that, and you expect to see, it´s fairly blobby here
and it´s getting sharper as you go that way.
Now this is a very small section of the sky, Hubble space telescope´s field of view is 1/40 the size of the moon,
so it doesn’t sample very much, so one of the things we were trying to do
is arrange to get a telescope with a large field of view out into space to make these maps very precisely and carefully
and to cover a big fraction of the sky and try and measure this sort of thing.
So now I’m going to take you on a little cosmic journey.
Ok, so we’re going to start at the sun and see how we’ve done with mapping.
So first we’re going to see the half billion stars that we know where they are,
pretty impressive that we know where half a billion stars are, so the sun is getting pretty faint.
Now we’re going to pick up some speed, you see the stars, we’re moving through the stars faster and faster.
Remember half a billion stars is less than 1% of the stars in the Milky Way.
So even though it’s a large number of stars we have to go to French impressionists to make what the galaxy looks like.
So you didn’t wonder, this is the Milky Way.
Is that high enough resolution or is it out of focus for you guys?
Looks so much better on my screen, I’d have a hard time seeing that.
So you see we live in a small group of galaxies, it´s less than Andromeda, the big galaxies,
you all understand what this is later, those are the wedges, they’re just compressed in this picture for perspective.
So the Milky Way and Andromeda there, and there’s some small other galaxies around us.
And you´ve got to go out a long way before you start seeing some other galaxies.
We were just a little group, you know, hanging out by ourselves.
And you got to go a long, long way before you start running into other galaxies.
So if you didn’t feel insignificant when you saw the sun go away, now you see the galaxy go away,
before you start seeing other galaxies.
Now you see there’s a lot of galaxies.
We’re going really fast.
And if we go past the galaxies, then regular galaxies get too faint to see,
we can only see the large red luminous galaxies and quasars.
So now we’re really zipping our way across the universe.
It’s very hard to see there.
Let me show it to you in a slightly definitely way, so we’re zooming out, those are the Sloan galaxies in white
and then we’ll see the large red luminous galaxies which Sloan also measured and then quasars showing up.
And if we go far enough we’ll see one of our old friends, microwave background,
and in a minute we’re outside of the universe, right, we’re outside the visible universe
but this is telling us how well we’re doing so far in mapping the universe.
You can see here’s the cosmic microwave background, that’s as far as we can see and there’s what we’ve sampled so far.
Now it looks pretty impressive but I have to admit we cheated a little,
we didn’t make the scales quite linear so that the stuff on the insides are sort of a little more emphasised.
I want to tell you about the 2 new surveys that are underway.
BOSS has already started and BigBOSS is what we’re planning to do.
So why do we call them that?
Well, BigBOSS is to do 10 times better than BOSS, so we had a million galaxies, BOSS is trying to do 5 million galaxies,
we want to go to 50 million galaxies.
So here’s the original survey I was showing you on a more linear scale, this is about right here,
that original Sloan survey, BOSS is the Sloan 3, it´s going to go in this region, and then BigBOSS is this,
it´s 50 million galaxies so it wedges out to here, not the whole thing but wedges out this far.
And then quasars, a million quasars, where you measure the spectra, you see the intervening material,
measure the spectra very accurately and then you can reconstruct what material there is between the quasars
and the galaxies that you´re measuring in between.
So this isn’t hair, this is the fact that you´re sampling along those lines of sight,
except there should be a million lines and there should be 50 million dots in here.
That’s what our goal is, that’s pretty ambitious and we figure that it´s going to take us, you know,
we’re going to start when BOSS is finished in 2015, so BOSS is sort of a tune up, by then we’ll have BigBOSS constructed,
and then we’ll run northern hemisphere and southern hemisphere
and it will probably be another 6 years because to measure 50 million galaxies, we can only measure 5000 at a time.
So the other thing that people would like to do, and there are tests that are going on for that,
is to look at the hydrogen itself directly through this 21 centimetre line of hydrogen.
But if you go out to where the redshift is 9 or 10, if the redshift were 10 it would be 210 centimetres,
so you have to find a place on the earth where there’s nobody broadcasting anything
and no cells giving out that unusual frequency.
And you can try and make a map in here, you could in principle map over this whole region,
but in fact there’s reasons to start in this region, it’s sort of the more optimum region to do it.
So there’s a goal to try and go and measure this before there are stars, when you can just use the hydrogen gas itself.
So we’re beginning to try and sample the whole universe.
There’s some places that’s going to be tough, but it´s really still a sample,
but you know 50 million galaxies is a pretty good start, so you can talk about the scale,
what scale you´re actually seeing things on and which tools you´re using.
Are you using the 21 centimetre line, are you using gravitational lensing, are you using the galaxy surveys,
using clusters of galaxies which I didn’t talk about and then the cosmic microwave background.
The cosmic microwave background goes into here, you get overlap
because you have to make these things mash together and fit together.
So I remind you we’ve been doing this stuff on the CMB, we’re getting pretty advanced at that
but we’re thinking there’s the connection between the fundamental microphysics,
the particle physics that’s going on and the macrophysics that’s out there
and if this thing wasn’t so bad you would see there’s some hidden dark energy here, can you guys see that?
I can’t see it, this says dark energy here, says dark matter there,
it says theory over there, there’s 3 elusive things that we have to deal with.
So sorry that the room isn’t clear enough.
So that’s where we are today, we have this model which seems like the way spin model,
because it would earlier be in 3 dimensions unless it’s fierce,
but we actually have a fairly substantial amount of evidence for it and it´s standing up pretty well,
so it´s evidence, the Big Bang is well established, Nobel Prizes and science are all around,
there’s 4 Nobel laureates here who got Nobel Prizes for setting the CMB,
and here we now have a strange composition of the universe, the stuff that we’re used to,
the things that we’ve been studying for many years, they’re only about 4% of the universe
and about 95% of the universe is stuff that we’re just beginning to elucidate.
We know some of its properties but we haven’t actually seen it, we don’t know how to calculate the theories,
except the simplest possible models.
We want to know, can we use the universe as a laboratory for fundamental physics?
How did inflation happen?
What's a dark energy, what's a dark matter?
Why is there an excess of matter over antimatter?
And are there other things, are there other relics, are there extra dimensions, are there other things?
There’s many things that we want to know and find out from this.
So I think I’ll stop at this point, because I wanted to leave a little time for you guys to ask questions,
but I ran over I guess, nobody asked enough questions, so, let´s stop and see if there’s any questions.